Researchers at the Fritz Haber Institute in Berlin, Germany have developed an experimental process to convert the green-house gas, carbon dioxide, CO2, into ethanol, aka C2H5OH. This is done by introducing copper and zinc oxide catalysts to reduce carbon dioxide into ethanol.
Outside of alcoholic beverages, ethanol is used as an additive in gasoline to produce gasohol. The conversion of CO2 to ethanol directly would help solve two problems at once.
One it would possibly help reduce the atmospheric concentration of CO2, and secondly, it may put an end to the idiotic practice of putting food into the gas tanks of cars and trucks.
Trivia: Alcohol or ethanol is second only to caffeine as the most consumed drug on the planet. Stimulants vs. depressants. We can’t make up our minds, so to speak.
Source: Fritz Haber Institute of the Max Planck Society. Graphic: A carbon dioxide molecule.
Weather and climate are often confused as being the same, but they are definitely not the same. Weather is what you worry about when you’re planning a trip to the beach or a hike in the mountains. Weather patterns occur for a few days, a few weeks, maybe even for a few years then those patterns dissipate, and everything reverts to the mean. The 1930s, in the plain states of North America, experienced a prolonged drought, hot temperatures, and high winds, putting dirt into everything everywhere. These conditions lasted about a decade then the weather returned to what most would call normal conditions. Exceptionally cold winters show up every 20-40 years, lasting until you finally decide to move to Florida and then they’re over.
The point is that weather events can set temperature and precipitation records for that day or that year but then it all settles down with a retreat from the extremes back to normal conditions. This is not a change in climate, just a change in the weather.
Climate is a long-term event that has a period of at least 30 years and usually a lot longer and the changes tend to last for 100s of years. Climate is something you shouldn’t worry about. It may impact your grandchildren or great grandchildren, but you are going to live out your life in blissful happiness of carping about the rainstorm ruining your tennis game and succulents, but it will not be an end of life as you know it or your life, or your neighbor’s life, just another day riding out the storm. Then it’s gone.
When the climate does change volcanoes seem to have an overwhelming part to play in initiating the change. To cause climate change really big explosive volcanos are needed, not the run of the mill Mt. St. Helens or Mt. Pinatubo variety. They were spectacular for sure, and they did drop the temperatures for a year or two, but they were not climate changing volcanoes. On the Volcanic Explosive Index scaled from 1-8, 8 being an absolute monster, Mt. St. Helen and Mt. Pinatubo were mere kiddies throwing tantrums, only VEI 5 and 6s, respectively. Big but the grownups just smile at their antics.
Climate changing volcanoes need to be rated in the 7 and 8 categories. These VEI 7 and 8 volcanoes eject 100-1000s of cubic kilometers of material into the troposphere and stratosphere affecting climate for 100s or years. One VEI 8 volcano can likely initiate global cooling by itself, but VEI 7 volcanic eruptions will likely need an assist from several smaller volcanic eruptions to affect climate change. There have been no VEI 8 volcanoes in the Holocene and only 4 VEI 7 volcanoes have erupted in the last 10,000 years: Mazama 5700 BC, Kikai 4300 BC, Samala 1257 AD, and Tambora 1815 AD.
Tambora cooled the Earth by about 5.5 degrees Fahrenheit and led to a year without summer in 1816. This year was also referred to as “Eighteen Hundred and Froze to Death” and the “Poverty Year” because of the extreme weather conditions. In New England, for instance, six inches of snow fell in June and every month of the year had a hard frost. These conditions led to hoarding and significant price increases for agricultural commodities, causing many people to go hungry. It is estimated that tens of millions of lives were lost to the volcano, either directly from the explosion or indirectly from starvation due to crop failures and disease. Tambora was a massive volcano but even it by itself was insufficient to cause any lasting climate change. A few years after Tambora or for that matter, Mazama and Kikai, the weather returned to normal. Samala is a different matter and it’s discussed below.
Be happy, don’t worry. Below are some examples of when the climate really did change and luckily for us, we are not due for anything life changing for a few hundred more years.
Pre-Holocene andHolocene Climate Changes:
FootNoteA
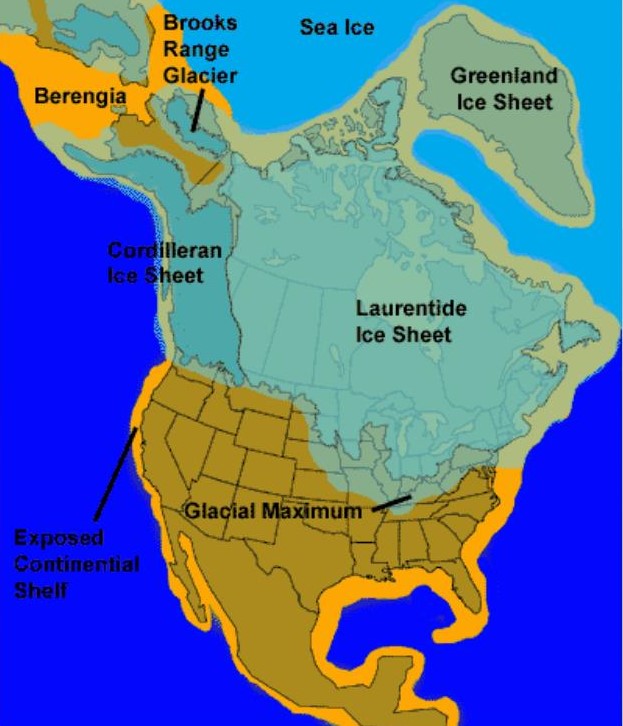
The Wisconsin glaciation, North America’s last occurrence of continental glaciers, began between about 100,000 and 75,000 years ago and ended about 11,000 years ago. At its peak, the ice sheets, in places almost 2 miles thick, covered most of Canada, the Upper Midwest, and New England, as well as parts of Idaho, Montana, and Washington. The Cordilleran Ice Sheet, which covered the area between the Rocky Mountains and the Pacific coast, had expanded south as far as the state of Washington. The Laurentide Ice Sheet, which covered the eastern four-fifths of the continent, had advanced as far as southeastern South Dakota, northern Iowa, central Illinois, Indiana, Ohio, and northern Pennsylvania and New Jersey. The Earth’s tilt is one of the likely contenders for the formation of Wisconsinian glaciers although some speculate it may have been due to a decrease in CO2.
The Last Glacial Maximum, LGM, the greatest extent of the Wisconsinan ice sheets, occurred approximately from 26,000-20,000 years ago. The beginning of the end of the LGM in the northern hemisphere commenced around 20,000-19,000 years ago with the West Antarctica ice sheet starting to decline in size around 15,000-14,000 years ago. The West Antarctica melting of the glaciers led to a rise in the sea levels of approximately fifty feet in three hundred years. The current rate of sea level rise is approximately 14 inches per 100 years. The seas from 14,000-6500 years ago rose 360 feet due to world-wide melting of the Wisconsinian aged glaciers. The melting of glaciers from the LGM is attributed to changes in the Earth’s orbit or more solar energy hitting the northern hemisphere, along with the rise in CO2 which came from the overturning of the deep waters in the Southern Ocean.
FootNoteB
The Younger Dryas period saw a return to glacial conditions approximately 12,900-11,700 years ago. During this time, temperatures fell 7-18 degrees Fahrenheit, with this drop occurring within one hundred years; overnight in geological time. There is no consensus on the cause of this return to glacial conditions but two of the leading contenders are enormous amounts of fresh water from melting glaciers mixing with the sea water causing the ocean currents to slow down, leading to a cooler Europe and North America along with increased Arctic Sea ice. It is also believed that increased fresh water into the seas can also cause warming, so scratch your head and buyer beware. The other possibility is increased volcanic activity.
FootNoteC
The Neoglacial Period occurred about five thousand years ago, around the time of the beginning of the Early Dynastic Period in Egypt and continued until the medieval warm period. During this period glaciers advanced globally. Temperatures were thought to be about 0.5-degree Fahrenheit cooler than today. The 26,000-year Milankovitch cycle is thought to be the cause of cooling. This cycle affects the tilt of the Earth and thus the amount of sunlight reaching the planet’s poles.
The Medieval Warm Period (MWP) or the Medieval Climate Optimum or the Medieval Climatic Anomaly, occurred from approximately 950-1250 AD. It is predominately a Northern Hemispheric event that raised temperatures 3- or 4-degrees Fahrenheit. Europe during this period reported alpine tree lines rising in elevation and increased crop yields. Why MWP occurred is poorly understood and potential causes include increased solar activity and or reduced volcanic activity. This period was followed almost immediately by the Little Ice Age.
The Little Ice Age was a time of regional cooling beginning in the 14th century and continuing into the mid-19th century or 1300-1850. Evidence from glacial advances throughout the world suggests that the cooling did not occur at the same time everywhere. The cooling is estimated to have been 2-3.5 degrees Fahrenheit lower than present temperatures. Various theories have been brought forward for why the temperatures dropped during this period but heightened volcanic activity is the favored cause. On the island of Lombok in Indonesia in 1257 the volcano Samalas erupted with a VEI of 7, making it one of the largest volcanic explosions in the last 10,000 years. Before and after Samala erupted another three smaller volcanic eruptions in 1230, 1276, and 1286 followed suit which likely led to increased cooling due to excessive volcanic material in the troposphere and stratosphere. These smaller eruptions are inferred from other data, but the exact volcanoes are unknown.
The Modern Warm Period followed the Little Ice Age, and the Earth is still in the midst of this climate period.
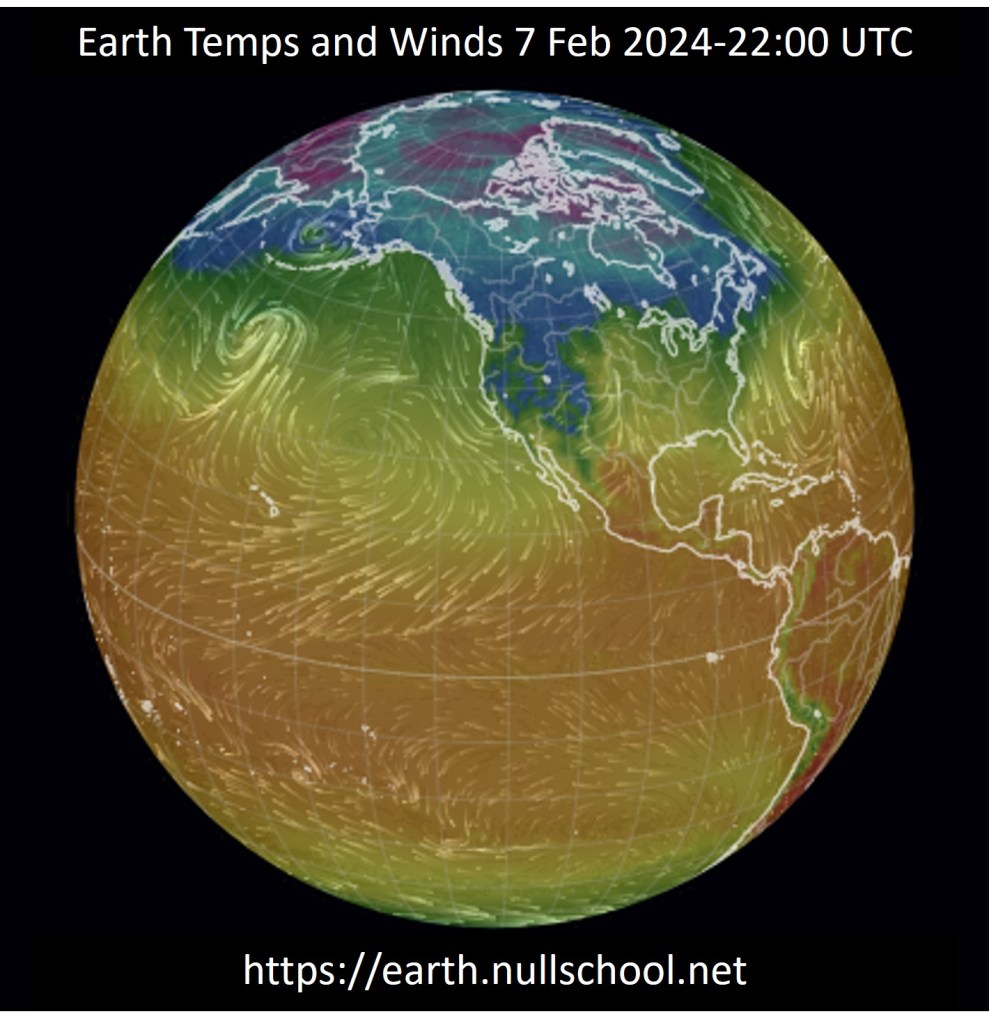
The northern great plains of the U.S. experienced an exceptionally mild 2023-2024 winter, about 10 degrees Fahrenheit above normal, due to the onset of a strong El Nino event, now called a Super El Nino by some. As is shown below, this categorization as super is overstated. Hyperbole by the press is a bad habit they just can’t seem to break.
National Geographic defines an El Nino, along with its sister event, La Nina as, “…a climate pattern that describes the unusual warming of surface waters in the eastern equatorial Pacific Ocean. El Nino is the “warm phase” of a larger phenomenon called the El Nino-Southern Oscillation (ENSO). La Nina, the “cool phase” of ENSO, is a pattern that describes the unusual cooling of the region’s surface waters. El Nino and La Nina (EN) are considered the ocean part of ENSO, while the Southern Oscillation (SO) is its atmospheric changes.”
El Nino events last from 9-12 months on average with a rare occurrence lasting up to 18 months. La Nina events can endure for longer periods than El Ninos with some lasting up to 24 months. Both weather events reoccur every 2-7 years for reasons unknown but may be, and this is stretch on my part, related to polar and core wobbles. Earth’s axis experiences two discrete periodic oscillations; the 14 month Chandler Wobble and a 12 month wobble. These two wobbles cause the poles to trace a spiral path over about 6.5 years. Earth’s inner core mysteriously wobbles with a periodicity of approximately 8.5 years. The combination of these wobbles may help explain the peridicity of ENSO weather events.
The National Oceanic and Atmospheric Administration states: “El Nino usually causes increased rainfall and sometimes destructive flooding. La Nina, however, usually causes drier weather in the South, but the Northwest tends to be colder and wetter than average. Even though El Nino occurs in the Pacific Ocean, it often reduces the number of hurricanes that form in the Atlantic Ocean. Conversely, La Nina events tend to be related to an increase in the number of Atlantic hurricanes.”
Hurricanes in the Atlantic Basin occur less often, supposedly, during El Nino than La Nina. This is because there is less vertical wind shear in the troposphere during a La Nina than an El Nino. Wind shear tears hurricanes apart while the lack of wind shear allows hurricanes to form and intensify. Wind shear in the troposphere develops due to pressure gradients which in turn are caused by temperature contrasts between the ocean surface and high-altitude tropospheric air. During El Nino warm ocean surface waters create a greater contrast with the high-altitude cool troposphere air than the cooler La Nina ocean surface waters do. Wind shear lessens when the temperature contrast decreases between the ocean surface and higher altitudes. When ocean temperatures are higher, wind shear is greater resulting in fewer hurricanes. With lower ocean temperatures, wind shear is less resulting in more hurricanes.
This is the theory, whereas actual hurricanes making landfall appear to increase in numbers after weak to moderate El Ninos rather than strong ones. There doesn’t appear to be any correlation between strong El Ninos and increases in hurricanes making landfall during the subsequent La Nina events.
This year’s El Nino was driven by a larger than normal spike in Pacific Ocean temperatures that were about 0.5-degree Fahrenheit above 2022 temperatures. This is considered an exceptionally large increase. This has led to warmer, dryer winters in the upper mid-western states of the U.S. along with greater precipitation in the western U.S.
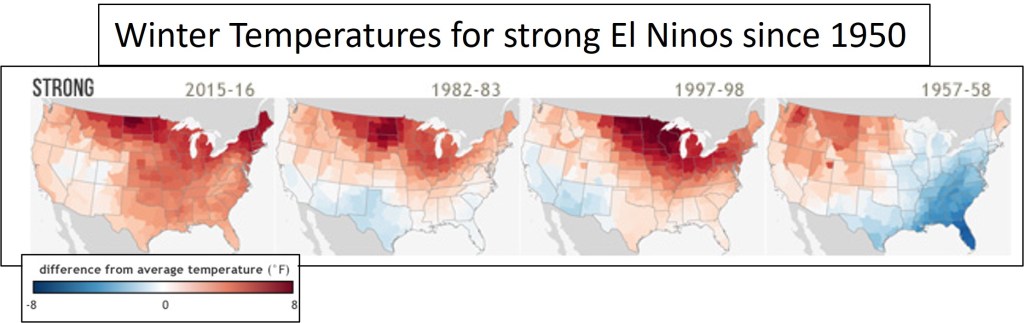
The graph below, from NOAA Climate.gov, shows the change in average winter temperatures during strong El Ninos since 1950. In northeastern North Dakota during the 2023-2024 winter, from the months December to February, temperatures are about 10 degrees warmer on average than the previous year’s winter temperatures. This increase is similar to what was experienced in the 1997-1998 El Nino.
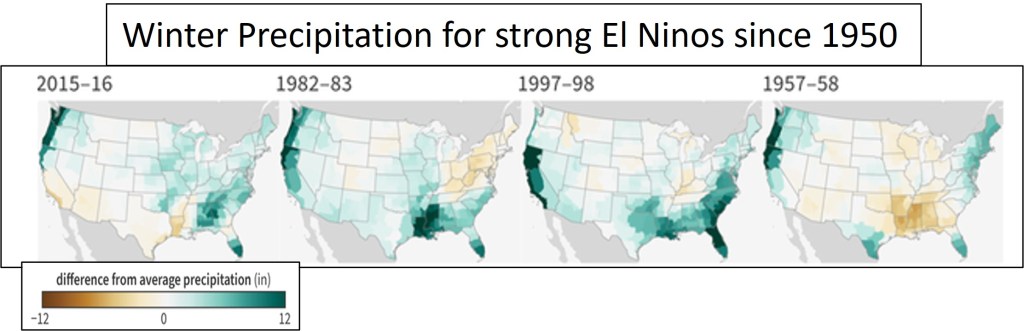
The graph below, again from NOAA Climate.gov, shows winter precipitation during strong El Ninos since 1950. In Long Beach, California the 1997-1998 winter brought 17.77 inches of rain whereas the winter of 2023-2024 has already brought 13.88 inches of rain with 19 days left in the month of February to add to that total. This year’s winter precipitation in Long Beach should be similar to what occurred in the 1997-1998 winter season.
The winter that is occurring in northeastern North Dakota is like what happened temperature-wise 26 years ago during the 1997-1998 winter. Similarly, in Long Beach California the El Nino induced precipitation is likely to be about the same as the totals for this same El Nino event.
In conclusion the strong El Nino of 2022-2023 is a carbon copy of the strong El Nino that occurred 26 years ago during the winter of 1997-1998. The end of 1997-1998 El Nino was followed by seven hurricanes making landfall during the 1999 season suggesting the 2024 season should see about the same number of hurricanes making landfall.
Oh no, they say, he’s got to go Go go Godzilla, yeah Oh no, there goes Tokyo Go go Godzilla, yeah
…
History shows again and again How nature points up the folly of men
Songwriter: Donald Roeser a.k.a. Buck Dharma 1977 (Blue Oyster Cult)
In the shadows, as far as music is concerned and not nearly as fun as the Godzilla ditty above we have ABBA a less memorable example of fantasy theatrics:
We do the King Kong song, won’t you sing along Listen to the music and it couldn’t go wrong We do the King Kong song, gotta sing along Can’t you hear the beating of the monkey tom-tom? Listen to the rhythm of the King Kong song
Songwriters: Benny Andersson and Bjorn Ulvaeus 1974 (ABBA)
Recently on Twitter there was some tit-for-tat centered around the Antarctic ozone hole. One side was asking, somewhat sarcastically, why the ozone hole isn’t in the news anymore and the other side replying that it wasn’t in the news anymore because the problem was solved…duh. Journalists and low info opinionistas representing both sides of the argument were putting forth gotcha strawmen that signified fury and snark but proved little and settled nothing. Both sides were uninformed and wrong which is not to say that I’m an expert in ozone and holes, well maybe holes, I dig a lot of them. The ozone hole is in the news, but you must look for it, usually in the science related press, and the consensus is that the solution is found, but there are still questions to answer and the models may need tweaking.
Let’s get the tweaking out the way first before moving on to the problem and possible solution. The scientific method requires an explanation or a hypothesis for an observation in the natural world, for example the ozone hole is caused by ozone destroying CFCs or chlorofluorocarbons such as Freon, sometimes expressed as a R-12 or CCl2F2 (one Carbon, two Chlorine, two Fluorine). An explanation needs to be testable, usually involving a prediction that will support the initial hypothesis such as, if ozone destroying chlorofluorocarbons are eliminated from the atmosphere the ozone hole will ‘close’. The ozone hole is closing but probably not as smoothly as the models first predicted leading to my use of the technical term: tweaking. Just so we don’t get ahead of ourselves let me be clear that most scientific hypothesis and the models generated to support them need tweaking. Most hypotheses are falsifiable as opposed to scientific theories which are not. If a theory is falsifiable, it is no longer a theory. A hypothesis on the other hand may just need a minor adjustment, or major, for the explanation to subsume the new data and or observations and still be valid.
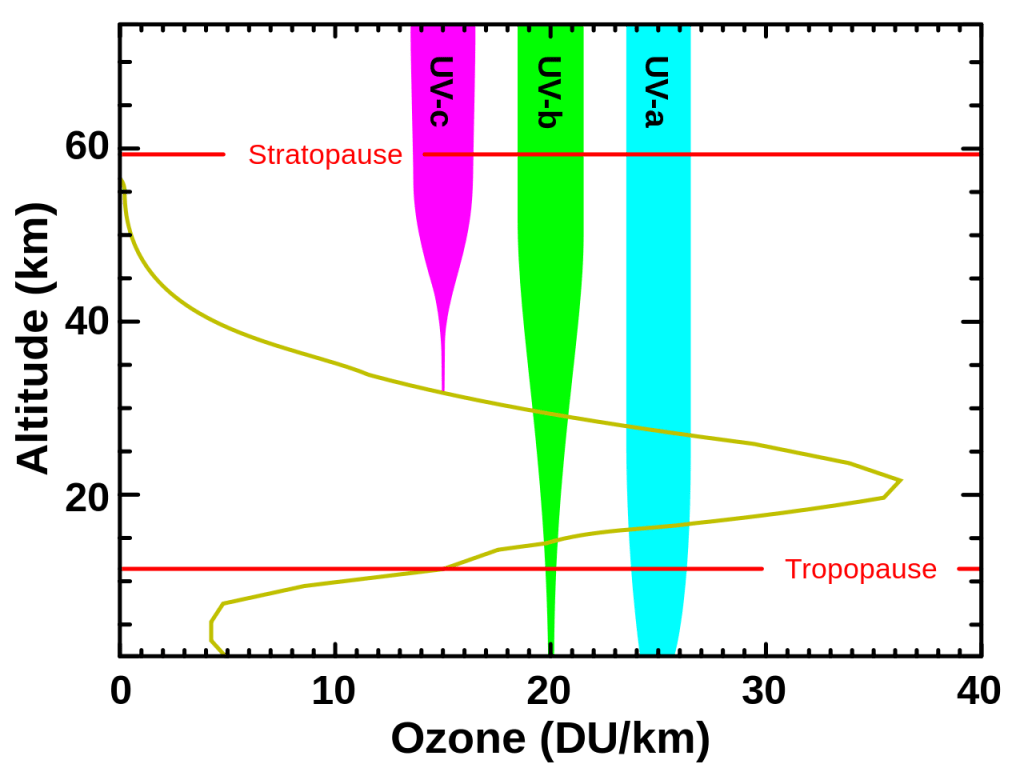
The importance of ozone, O3, and dioxygen, O2, in the atmosphere is that it filters out some to most of the harmful effects of ultraviolet, UV, radiation that comes to the Earth from our Sun. UV radiation comes in three main flavors: UVA, UVB, and UVC progressing from the lower frequency, longer wavelength UVA to the higher frequency, shorter wavelength UVC. UVC is entirely removed by O2 in the upper half of the stratosphere, an atmospheric layer 7-50 kilometers above the surface of the Earth. UVB radiation is mostly removed by ozone in the lower half of the stratosphere, but some of the radiation does make it to the surface of the Earth. UVA radiation travels to the surface of the Earth practically unimpeded.
The graph to the left shows the relative amounts or intensity of the three flavors of UV radiation that pass through the Earth’s atmosphere. The vertical axis on the graph is height above sea level while the horizontal axis measures the amount of ozone in Dobson units per kilometer (DU/km) in the atmosphere. The yellowish curve trending sideways on the graph shows the relative density of ozone in the atmosphere. The outline of the yellowish curve is essentially the ozone layer, with its densest O3 concentration between 20-25 kilometers above the surface of the Earth. UVC in purple is filtered out by O2 and is essentially removed before it even reaches the top of the ozone layer. UVB in green is dramatically reduced as it passes through a healthy ozone layer. The greater the density of the ozone layer the greater the reduction in UVB radiation. UVA rays experience very little reduction in intensity or amount as they traverse the atmosphere.
The harmful effects of UV radiation are significant and different for the different frequencies. Since UVC does not reach the surface of the Earth it is not a big long-term concern but may cause skin burns and eye injuries from artificial sources such as tanning beds. These injuries usually resolve themselves in a week. UVB radiation has been implicated in skin cancers, sunburns, skin blistering, premature aging, and immune suppression. It is also held responsible for darkening and thickening of the skin. UVA is responsible for tanning, sunburns, premature aging, wrinkles, and some skin cancers. There are also benefits from UV radiation. UVC radiation has been used to reduce the spread of bacteria in water, air, and solid surfaces. Hospitals during the height of our collective Covid madness had these UVC light sources dispersed throughout their facilities. UVB, in short time intervals, helps the body in the production of vitamin D useful for maintaining bone and muscle health. UV therapy or phototherapy may also assist in treating rickets, psoriasis, and eczema. Too much exposure to UV radiation can be detrimental to your health but one should get 15-20 minutes of sunlight per day.
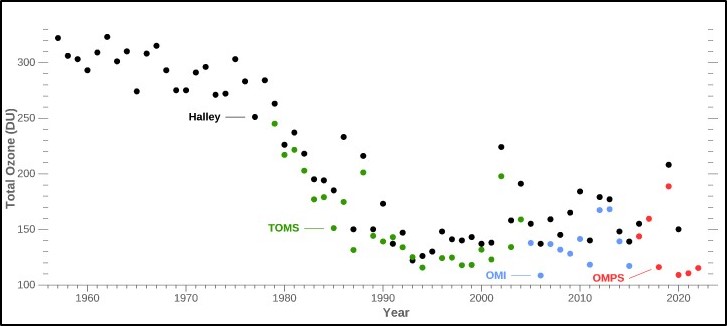
In the Antarctic summer of 1956, the British Royal Society founded the Halley Bay Base Research Station, on the Brunt Ice Shelf. It was built in partial preparation for the International Geophysical Year of 1957-58. (Only governments can dictate singular nouns to be plurals.) As part of their mandate the Royal Society began to collect ozone measurements indirectly using a Dobson Spectrophotometer. The black dots in the graph to the left are data collected by the Halley Base at the surface while the colored dots are derived from NASA satellite measurements. From the beginning of the measurements at Halley through the end of 70s the results showed a slight but noticeable decrease in ozone in the skies over Antarctica. From 1980 onward the loss of ozone as measured from Halley and NASA satellites became pronounced and until the mid-1980s, inexplicable.
In 1985 Joe Farmin and his team with the British Antarctica Survey published a paper in Nature describing this catastrophic 40% loss of ozone over the south pole in less than 10 years. His team also identified the atmospheric release of CFCs as the probable causative agent in creating the ozone hole over the Antarctic.
Additional chemical, meteorological, and atmospheric research in 1986 through 1988 produced the needed theoretical and empirical evidence to implicate chlorine as the ruinous perpetrator responsible for the global loss of ozone. This research and the recognition of the detrimental health effects due to the loss of ozone led directly to the Montreal Protocol, an international treaty designed to protect and heal the atmospheric ozone layer.
The treaty was signed in 1987 with an effective implementation date of 1 January 1989. The treaty has been universally ratified. The main purpose of the treaty was to phase out various forms of man-made chlorine and bromine chemicals, both halogens, that make their way into the stratosphere. In 2012 it was estimated that 98% of the ozone depleting chemicals have been phased out and their concentration in the stratosphere was beginning to decline. In 2018 China, a signatory to the treaty, was implicated in the continued production and release of CFCs.
Current ozone models predict that ozone levels in the northern and southern hemisphere mid-latitudes along with the Artic will revert to 1980 levels by the 2040s. Antarctic ozone should revert to 1980 levels sometime in the mid-2060s. These estimates have fluctuated by 20-30 years, plus or minus since the first predictions came out in the 1990s.
Ozone is three atoms of oxygen combined into one molecule and is found in higher concentrations in the lower to middle parts of the stratosphere which is 7-50 kilometers above sea-level, where it absorbs solar derived ultraviolet radiation. This higher concentration of ozone in the stratosphere is usually referred to as the Ozone Layer. An ozone molecule will split into a single oxygen atom and a two-oxygen molecule, O2, after absorbing a packet of bond breaking UVB radiation. The oxygen atom and the O2 molecule will eventually recombine into an ozone molecule under the right conditions. This oxygen cycle of combinations and breakups are temperature dependent with colder temperatures retarding recombination of oxygen atoms and O2 molecules into ozone molecules. The colder it is in the stratosphere the longer it takes to produce new ozone and it can get very cold in the stratosphere, especially in the Antarctic skies.
A visual confirmation of very low temperatures in the ozone layer of the stratosphere is the presence of Polar Stratospheric Clouds or PSCs. These clouds were likely seen by 19th and early 20th century explorers, including R.F. Scott in 1912. These clouds probably have existed in the Antarctic winter skies since the continent parked itself over the south pole towards the middle of the Cretaceous 100 million years ago. These are stratiform clouds made up of droplets of frozen water and nitric acid forming at temperatures below -78 degrees Celsius. Nitric acid is a catalyst also implicated in the destruction of ozone in the stratosphere.
Nitric acid does not have a strictly natural or human source but is an end product through chemical reactions with nitrogen oxide in the atmosphere. When nitrogen oxide absorbs sunlight in the atmosphere it reacts with O2 to form nitrogen dioxide. Nitrogen dioxide then reacts with water to produce nitric acid and more nitrogen oxide. Natural sources produce about 90% of the world’s nitrogen oxide including lightning strikes, volcanoes, oceans, and biological decay in soil and water. Human sources such as cars and trucks, coal-fired power plants, large industrial operations, ships, and airplanes account for the rest. Eliminating the planet of anthropogenically produced nitrogen oxide will not have any noticeable effect on the continued destruction of ozone in stratosphere by nitric acid although the possibility of supersonic jets passing through the stratosphere could theoretically introduce nitric acid directly into this atmospheric layer.
PSCs also electrostatically attract, concentrate, and store CFCs. Chlorine, the first C in CFC, is another catalyst that acts in concert with nitric acid to increase the destruction of ozone in the stratosphere. Chlorine atoms are released from the CFC molecules when the molecular bonds are broken through the absorption of atmospheric photons traveling from the Sun. The individual chlorine atoms then react with ozone to produce ClO plus O2. The ClO further reacts with a single oxygen atom to produce Cl and O2. With the chlorine atom freed from the oxygen atom it can start the whole ozone destructive cycle all over again. One chlorine atom will eventually destroy thousands of ozone molecules.
Ozone depletion is a global occurrence but due to Antarctica’s unique geography the depletion is most intense and widespread there. Due to the huge atmospheric temperature gradient between Antarctica and the tropics and the continent being surrounded by water causes winds over the southern land mass to move in a clockwise direction creating a stratospheric polar vortex. This vortex effectively contains and sustains a single static air mass over the continent that does not mix with the rest of the earth’s atmosphere, leading to the above-mentioned concentration and storage of CFCs.
During the Antarctic spring, atmospheric temperatures rise, and the frozen PSCs melt in the stratosphere to release all the CFCs and nitric acid compounds that were previously absorbed and stored in the cloud. The CFCs and nitric acid are now free to begin their destruction of ozone molecules. Through this process the infamous ozone hole is formed during the Antarctic spring which partially closes again during the Antarctic winter.
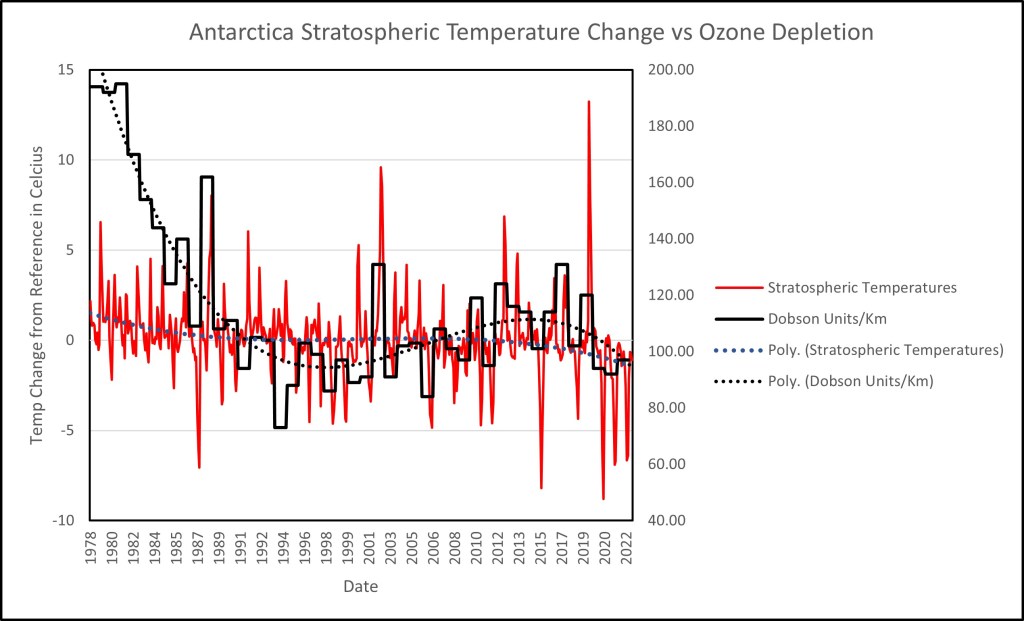
The graph to the right shows the south pole stratospheric temperature and Dobson NASA satellite derived data. The solid red line shows the temperature difference from the 1991-2020 monthly average. The dotted blue line is a polynomial fit to the temperature data that exhibits a slight cooling trend from 1979 through 2022. The temperature spikes, negative and positive occur during the Antarctic spring months of September through November. The temperature spikes usually come in pairs. A large negative value temperature spike in the Antarctic spring is generally followed by a large positive value temperature spike in the spring of the following year. This duality of temperature pairs seems paradoxical or at least inexplicable. The answer is not readily apparent but may lie in the fact that CFCs not only destroy ozone but are also powerful greenhouse gases. More powerful than CO2, methane, and laughing gas but less so than water vapor. In the cool spring years additional CFCs may be concentrated and stored in the stratosphere provoking a feedback loop with solar radiation that raises stratospheric temperatures the following spring. More on this below but this hypothesis is just an unsupported conjecture at this point. A noticeable exception to this observation is the three large negative temperature spikes in 2020, 2021, and 2023 which were not followed by corresponding positive spikes. Is this evidence of the removal of CFCs from the stratosphere causing less heat to be trapped there?
The black solid line on the graph above is the lowest yearly minimum Dobson Unit/km values. Lower Dobson values equate to larger ozone losses. The lowest yearly Dobson minimum represents the maximum ozone loss for that year. The yearly minimum Dobson values usually occur in Antarctica spring months of September through November. Higher or lower Dobson values do not display a significant correlation with the stratospheric temperature spikes except they both occur in the springtime suggesting other variables are at play. The other factors may include water vapor and ice, nitric acid, Chinese abrogation of the Montreal Protocols… The black dotted line is a polynomial fit to Dobson data and suggests that beginning in the early 2020s the ozone hole started increasing in size again. The ozone scientific community says it is closing.
And now, just to give you something else to chew on, putting Godzilla and King Kong together in the same playroom, it is known, as stated above, that CFCs, in addition to depleting ozone in the stratosphere, are potent greenhouse gases. In a 2013 University of Waterloo (Canada) discussion published on phy.org stated that “Chlorofluorocarbons (CFCs) are to blame for global warming since the 1970s and not carbon dioxide, according to new research from the University of Waterloo published in the International Journal of Modern Physics B…” Professor Lu, author of the published paper: Cosmic-Ray-Driven Reaction and Greenhouse Effect of Halogenated Molecules: Culprits for Atmospheric Ozone Depletion and Global Climate Change, comments that “Most conventional theories expect that global temperatures will continue to increase as CO2 levels continue to rise, as they have done since 1850. What’s striking is that since 2002, global temperatures have actually declined – matching a decline in CFCs in the atmosphere. My calculations of CFC greenhouse effect show that there was global warming by about 0.6 °C from 1950 to 2002, but the earth has actually cooled since 2002. The cooling trend is set to continue for the next 50-70 years as the amount of CFCs in the atmosphere continues to decline.”
The decline in surface temperatures was actually true at the time of Lu’s comment above, but global temperatures began to increase post 2013 and then began to decline again in the early 2020s. Is climate cyclic?
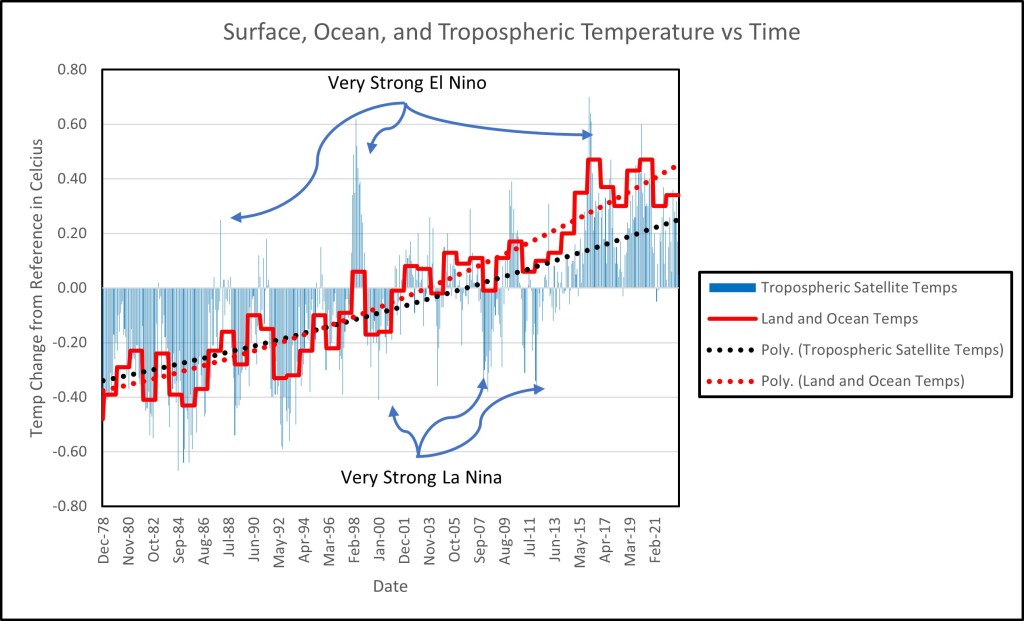
The graph to the left is derived from published NASA surface and atmospheric temperature data. The data in blue is globally collected satellite data for tropospheric temperatures: the atmospheric layer from the surface of the Earth to the base of the stratosphere. The y-axis is the monthly change in temperatures from the 1991-2020 average. Some of the large spikes in temperatures are attributed to exceptionally strong El-Nino or La Nina events–in other words, weather rather than climate. El-Nino generally is responsible for warmer than normal temperatures while La Nina generally leads to cooler than normal temperatures. There is a broad concurrence between the satellite and surface temperature collected data with both showing a slight cooling from 2015 to present day, but it is probably too soon to call this a long-term trend. The stall in temperature increase is curious and may be related to the removal of CFCs from the stratosphere.
The black dash line is a polynomial fit of satellite data trend. The satellite trend shows approximately a 0.6-degree Celsius warming since 1979. The solid red line is the globally collected surface and ocean buoy temperature data. The data was shifted to equal the 1979 satellite data points while retaining the actual slope. This was done to facilitate comparison between the data sets. The red dotted line is the polynomial fit to the surface land and ocean data trend. The surface data trend shows approximately a 0.8-degree Celsius warming since 1979. The surface and ocean data match the satellite data increase in temperatures until the beginning of century where the two data trends begin to diverge. This divergence is attributed to a land measurement heat island effect and statistical adjustments applied to the surface and ocean data that is not applied to the satellite data.
The old hypothesis was that eliminating CFCs from the atmosphere would restore the ozone layer to its 1980 only slightly damaged state.
It is now believed that higher temperatures will minimize the formation of PSCs and thus the collection, concentration, and storage of CFCs in these clouds thus reducing the loss of ozone. The elimination of man-made CFCs and other halogens will help reduce the rise in temperatures through loss of these greenhouse gases. Without CFCs the ozone layer may heal. Without CFCs the global mean temperature may not rise. That’s my new hypothesis–Godzilla and King Kong may be twins.
If I had a hammer I’d hammer in the morning I’d hammer in the evening All over this land …
Songwriters: Lee Hays and Pete Seeger.
Seeger and Hays’ ‘If I had a Hammer’, a song about justice and freedom, was first played by the writers at a testimonial dinner in 1949 supporting the US Communist Party. 1949 was the same year Seeger finally wised up to his former friend, and hero Joseph Stalin, disowning him for being the butcher that he had been all along. The song was eventually rebranded to support the civil rights and labor movements of the 1950s and 60s. After the Civil Rights Act of 1964 and Lyndon Johnson’s mid-sixties Great Society War on Poverty programs passed at the Federal level, the song found a new home among the environmentalists. With only a hammer in your fist all the world’s problems big, small, and imagined are nails.
Below are a few recent and past headlines concerning climate change which taken in aggregate are a mash of the silly. Climate change in today’s jargon, by the way, equals global warming. Models of any kind, whether on population, food, weather, climate, prices, crime, are not reliable more than a few years into the future and in the case of weather a few days at most.
Science Alert reports (5 December 2022): “A new study has revealed that small lakes on Earth have expanded considerably over the last four decades – a worrying development, considering the amount of greenhouse gases freshwater reservoirs emit.”
Frozen fresh water is good, but it could turn into fresh water.
BBC reports (3 November 2022): “Glaciers across the globe – including the last ones in Africa – will be unavoidably lost by 2050 due to climate change, the UN says in a report.”
Axios reports (9 January 2023): “If the Great Salt Lakecontinues to shrink at its current rate, it could disappear in the next five years, according to researchers from more than a dozen universities and environmental organizations.”
Salt water is double good because it’s main use is to make frozen water for Hollywood A-listers.
Unofficial Networks reports (5 May 2022): “The Great Salt Lake has decreased twenty feet in elevation from the record high set in 1985 to the record low achieved last year. … Pray to whatever god, gods, higher power, or whatever you believe in. Utah, and the American west need water, badly. (Editor’s note: the Great Salt Lake is not a source of drinking or irrigation water, but it is the primary source of water for the snow that falls on the Sundance Resorts. When it melts in the spring it turns into bad fresh water.)
Frozen fresh water is still good, and fortuitously the bad fresh water will take longer to appear.
UPI reports (6 January 2023): “Half of the world’s glaciers will melt and disappear before the turn of the next century, according to alarming new research that predicts greater fallout from global warming despite meaningful efforts in recent years to address environmental concerns.
Frozen fresh water is still good even if you must admit your models are bad.
CNN reports (8 January 2020): “The signs at Glacier National Park warning that its signature glaciers would be gone by 2020 are being replaced.
The signs in the Montana park were added more than a decade ago to reflect climate change forecasts at the time by the US Geological Survey, park spokeswoman Gina Kurzmen told CNN.
In 2017, the park was told by the agency that the complete melting off [sic] of the glaciers was no longer expected to take place so quickly due to changes in the forecast model, Kurzmen said.”
Frozen water could be bad when it appears but it’s hard to tell because the models are not good.
The Independent reports (20 March 2000): “Britain’s winter ends tomorrow with further indications of a striking environmental change: snow is starting to disappear from our lives. …Heavy snow will return occasionally, says Dr. Viner, but when it does we will be unprepared. …Snow will probably cause chaos in 20 years’ time, he said.”
It’s hurricane season but fortunately it’s winding down just to give way to the equally dreadful artic blasts of winter. During the summer season of excess wind, one’s thoughts, for the curious anyway, inevitably lead to queries, theories, or low proof opinions attempting to understand the causality, if any, between the frequency and strength of hurricanes with climate change or global warming. These are perfectly sensible and logical thoughts along with the subsequent questions, such as: Are hurricanes increasing in frequency due to climate change? Are hurricanes increasing in strength due to climate change?
These are valid questions, but likely a more germane question, or three, may be: If climate change is occurring what would the expected outcome be for the frequency and strength of hurricanes? Increasing? Decreasing? Something else? Are human gas inputs into the planet’s atmosphere causally linked to its energy budget?What methods and processes would one employ to answer these questions?
If you thought, I was going to attempt to answer the questions posed above you would certainly be wrong. I do not have the training or knowledge to provide even a precursory opinion, much less a tested and critiqued theory, but I do know how to analyze data and dagnabit I’m going to do just that.
The data used in the analysis below comes from NOAA for the years 1851 through 2021. The data are for hurricane strength only storms, category 1-5, that made landfall over the Atlantic Basin lower 48 states: specifically, the coastal states from Texas to Maine. Excluded from the analysis are all the named Atlantic Basin storms that formed but did not make landfall. Satellites, beginning in the 1960s, are able to observe and track all hurricanes whether they make landfall or not. The satellites have detected considerably more hurricanes developing in the Atlantic Basin than past data, based on storm landfall, suggested. There is a strong link between the recent increase in hurricane strength and frequency due increased observational capabilities rather than anthropogenic origins contributing to climate change.
The graph above plots wind speed in mph versus year of formation for Atlantic Basin hurricanes making landfall along the lower US 48. Years with no hurricanes making landfall are excluded but they account for about 20% of the analyzed interval. The basic analysis of the data shows that for the chosen years, 1851-2021, the average hurricane at landfall is a category 2 storm with an average speed of 100 mph. The trend line shows that the strength of landfall hurricanes has not appreciable changed over the last 170 years: slope of the trend line is 0.0077 or among friends can be taken as 0.
The graph above is the same as the first one shown except, I have attempted to account for the years with no hurricanes making landfall. I accounted for the years of no landfall by setting those data points to 0 mph. I am not comfortable with this approach but ignoring 20% of the data isn’t correct either. The analysis of the data is not significantly different from the previous graph. The average hurricane speed at landfall has decreased to 91 mph from 100 before with the average category being 2. 91 mph is a category 1 hurricane so the average category should be 1 but this is just a rounding up error. Slope of the trend line is again near 0.
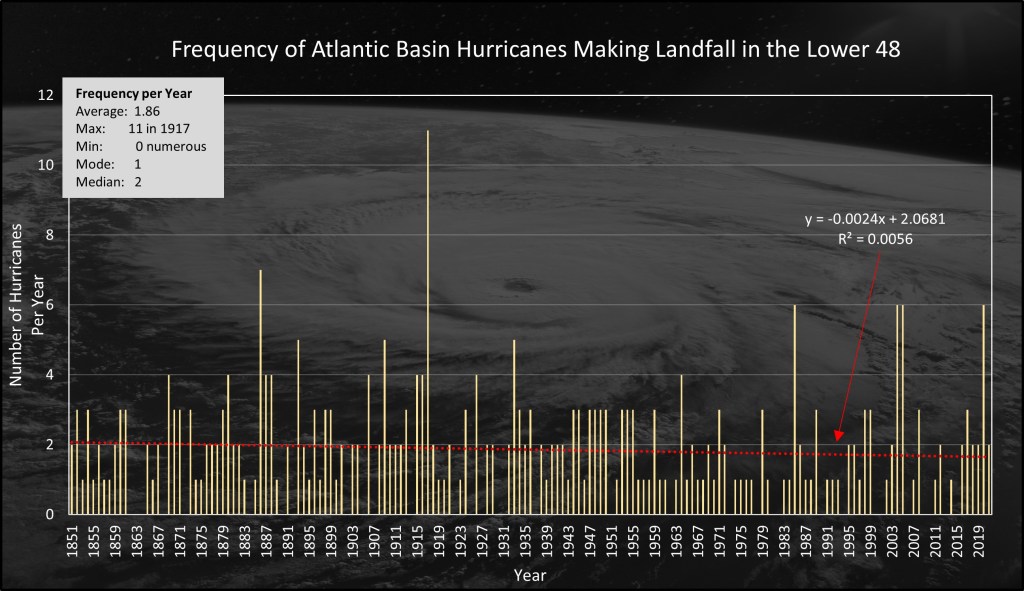
The frequency of landfall hurricanes also shows little variation over time. The average number of hurricanes is 1.86 per year with the maximum number of 11 hurricanes occurring in 1917. The gaps in the x-axis are the years with no hurricanes.
The NOAA hurricane data presents a picture of little to no variation in hurricane strength or frequency from 1851-2021. What this says about climate change or global warmer is indeterminant. The question asked above about what changes are expected in hurricane frequency and strength if climate change is occurring needs answering before hurricane variability can be linked to it as a known outcome or consequence.