The three greatest loss of life from natural disasters all occurred in China. Almost 7 million people died in two catastrophic floods and an earthquake.
1931 China Floods:
Death Toll: Estimated around 4 million people.
Details: These floods, caused by the overflow of the Yellow River, Yangtze River, and Huai River during an unusually wet summer, led to one of the most catastrophic events in human history. The death toll was from drowning and post-flood starvation.
Details: The Yellow River flood of 1887 inundated around 50,000 square miles and caused massive damage and displacement of communities along its banks.
1556 Shaanxi Earthquake, China:
Death Toll: Estimated around 830,000 people.
Details: 7-8 magnitude earthquake strikes …. China. Majority of inhabitants lived in loess-deposited caves, which collapsed when the quake struck.
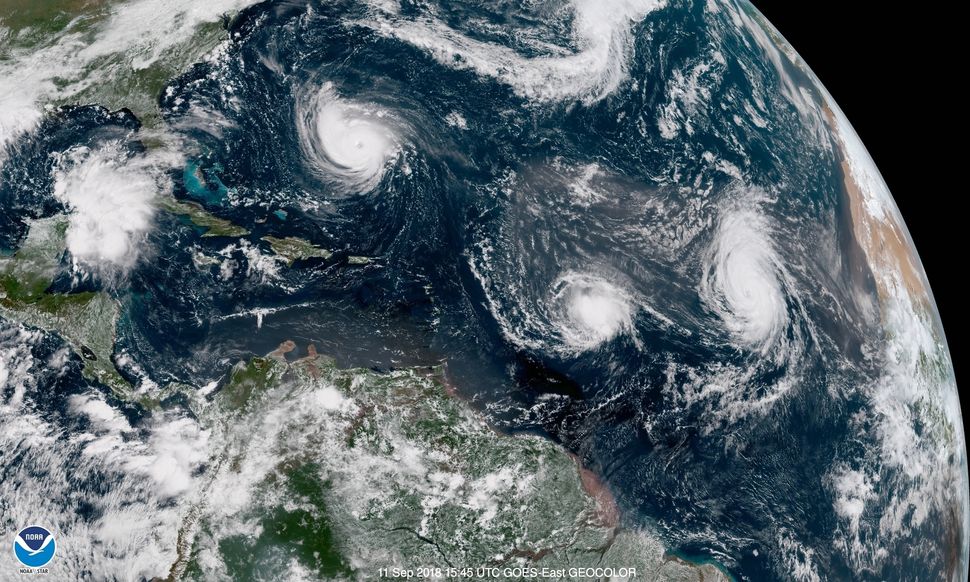
Michael Mann predicted 33 named storms in the Atlantic Basin this year. 33 storms have never occurred in 173 years of recorded Atlantic Basin storm history but because of climate change 2024 was going break all the records.
With less than 20 days until peak hurricane season, 5 named storms have developed so far during the Atlantic Basin 2024 season.
It is possible that another 28 storms will occur between now and Thanksgiving but not bloody probable. Mann’s model’s error bar since 2009 has been hovering around plus or minus 27%.
From an historical perspective, the mean number of Atlantic Basin storms that develop every year is 9. The number of storms strengthening into hurricanes each year is about 5 with major hurricanes, Cat 3 and higher, at 2 per year.
Source: Stanley Goldenberg. NOAA. Graphic: NOAA/GOES-East.
Weather and climate are often confused as being the same, but they are definitely not the same. Weather is what you worry about when you’re planning a trip to the beach or a hike in the mountains. Weather patterns occur for a few days, a few weeks, maybe even for a few years then those patterns dissipate, and everything reverts to the mean. The 1930s, in the plain states of North America, experienced a prolonged drought, hot temperatures, and high winds, putting dirt into everything everywhere. These conditions lasted about a decade then the weather returned to what most would call normal conditions. Exceptionally cold winters show up every 20-40 years, lasting until you finally decide to move to Florida and then they’re over.
The point is that weather events can set temperature and precipitation records for that day or that year but then it all settles down with a retreat from the extremes back to normal conditions. This is not a change in climate, just a change in the weather.
Climate is a long-term event that has a period of at least 30 years and usually a lot longer and the changes tend to last for 100s of years. Climate is something you shouldn’t worry about. It may impact your grandchildren or great grandchildren, but you are going to live out your life in blissful happiness of carping about the rainstorm ruining your tennis game and succulents, but it will not be an end of life as you know it or your life, or your neighbor’s life, just another day riding out the storm. Then it’s gone.
When the climate does change volcanoes seem to have an overwhelming part to play in initiating the change. To cause climate change really big explosive volcanos are needed, not the run of the mill Mt. St. Helens or Mt. Pinatubo variety. They were spectacular for sure, and they did drop the temperatures for a year or two, but they were not climate changing volcanoes. On the Volcanic Explosive Index scaled from 1-8, 8 being an absolute monster, Mt. St. Helen and Mt. Pinatubo were mere kiddies throwing tantrums, only VEI 5 and 6s, respectively. Big but the grownups just smile at their antics.
Climate changing volcanoes need to be rated in the 7 and 8 categories. These VEI 7 and 8 volcanoes eject 100-1000s of cubic kilometers of material into the troposphere and stratosphere affecting climate for 100s or years. One VEI 8 volcano can likely initiate global cooling by itself, but VEI 7 volcanic eruptions will likely need an assist from several smaller volcanic eruptions to affect climate change. There have been no VEI 8 volcanoes in the Holocene and only 4 VEI 7 volcanoes have erupted in the last 10,000 years: Mazama 5700 BC, Kikai 4300 BC, Samala 1257 AD, and Tambora 1815 AD.
Tambora cooled the Earth by about 5.5 degrees Fahrenheit and led to a year without summer in 1816. This year was also referred to as “Eighteen Hundred and Froze to Death” and the “Poverty Year” because of the extreme weather conditions. In New England, for instance, six inches of snow fell in June and every month of the year had a hard frost. These conditions led to hoarding and significant price increases for agricultural commodities, causing many people to go hungry. It is estimated that tens of millions of lives were lost to the volcano, either directly from the explosion or indirectly from starvation due to crop failures and disease. Tambora was a massive volcano but even it by itself was insufficient to cause any lasting climate change. A few years after Tambora or for that matter, Mazama and Kikai, the weather returned to normal. Samala is a different matter and it’s discussed below.
Be happy, don’t worry. Below are some examples of when the climate really did change and luckily for us, we are not due for anything life changing for a few hundred more years.
Pre-Holocene andHolocene Climate Changes:
FootNoteA
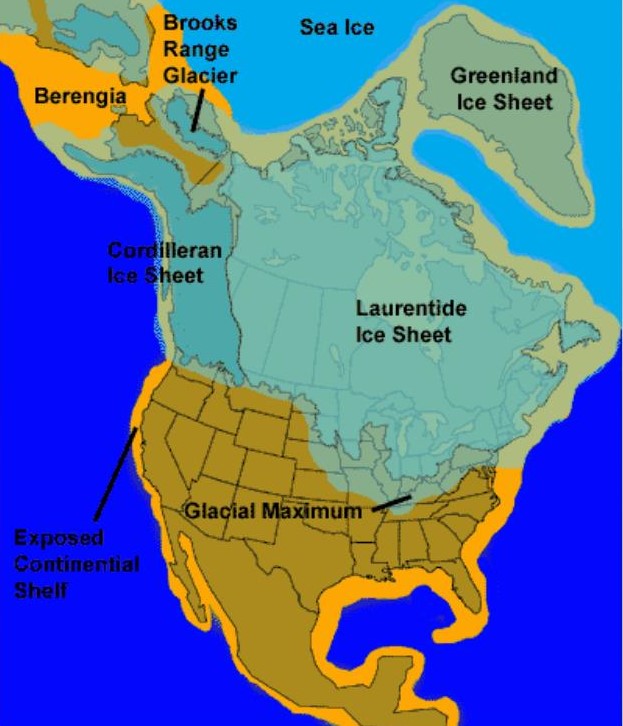
The Wisconsin glaciation, North America’s last occurrence of continental glaciers, began between about 100,000 and 75,000 years ago and ended about 11,000 years ago. At its peak, the ice sheets, in places almost 2 miles thick, covered most of Canada, the Upper Midwest, and New England, as well as parts of Idaho, Montana, and Washington. The Cordilleran Ice Sheet, which covered the area between the Rocky Mountains and the Pacific coast, had expanded south as far as the state of Washington. The Laurentide Ice Sheet, which covered the eastern four-fifths of the continent, had advanced as far as southeastern South Dakota, northern Iowa, central Illinois, Indiana, Ohio, and northern Pennsylvania and New Jersey. The Earth’s tilt is one of the likely contenders for the formation of Wisconsinian glaciers although some speculate it may have been due to a decrease in CO2.
The Last Glacial Maximum, LGM, the greatest extent of the Wisconsinan ice sheets, occurred approximately from 26,000-20,000 years ago. The beginning of the end of the LGM in the northern hemisphere commenced around 20,000-19,000 years ago with the West Antarctica ice sheet starting to decline in size around 15,000-14,000 years ago. The West Antarctica melting of the glaciers led to a rise in the sea levels of approximately fifty feet in three hundred years. The current rate of sea level rise is approximately 14 inches per 100 years. The seas from 14,000-6500 years ago rose 360 feet due to world-wide melting of the Wisconsinian aged glaciers. The melting of glaciers from the LGM is attributed to changes in the Earth’s orbit or more solar energy hitting the northern hemisphere, along with the rise in CO2 which came from the overturning of the deep waters in the Southern Ocean.
FootNoteB
The Younger Dryas period saw a return to glacial conditions approximately 12,900-11,700 years ago. During this time, temperatures fell 7-18 degrees Fahrenheit, with this drop occurring within one hundred years; overnight in geological time. There is no consensus on the cause of this return to glacial conditions but two of the leading contenders are enormous amounts of fresh water from melting glaciers mixing with the sea water causing the ocean currents to slow down, leading to a cooler Europe and North America along with increased Arctic Sea ice. It is also believed that increased fresh water into the seas can also cause warming, so scratch your head and buyer beware. The other possibility is increased volcanic activity.
FootNoteC
The Neoglacial Period occurred about five thousand years ago, around the time of the beginning of the Early Dynastic Period in Egypt and continued until the medieval warm period. During this period glaciers advanced globally. Temperatures were thought to be about 0.5-degree Fahrenheit cooler than today. The 26,000-year Milankovitch cycle is thought to be the cause of cooling. This cycle affects the tilt of the Earth and thus the amount of sunlight reaching the planet’s poles.
The Medieval Warm Period (MWP) or the Medieval Climate Optimum or the Medieval Climatic Anomaly, occurred from approximately 950-1250 AD. It is predominately a Northern Hemispheric event that raised temperatures 3- or 4-degrees Fahrenheit. Europe during this period reported alpine tree lines rising in elevation and increased crop yields. Why MWP occurred is poorly understood and potential causes include increased solar activity and or reduced volcanic activity. This period was followed almost immediately by the Little Ice Age.
The Little Ice Age was a time of regional cooling beginning in the 14th century and continuing into the mid-19th century or 1300-1850. Evidence from glacial advances throughout the world suggests that the cooling did not occur at the same time everywhere. The cooling is estimated to have been 2-3.5 degrees Fahrenheit lower than present temperatures. Various theories have been brought forward for why the temperatures dropped during this period but heightened volcanic activity is the favored cause. On the island of Lombok in Indonesia in 1257 the volcano Samalas erupted with a VEI of 7, making it one of the largest volcanic explosions in the last 10,000 years. Before and after Samala erupted another three smaller volcanic eruptions in 1230, 1276, and 1286 followed suit which likely led to increased cooling due to excessive volcanic material in the troposphere and stratosphere. These smaller eruptions are inferred from other data, but the exact volcanoes are unknown.
The Modern Warm Period followed the Little Ice Age, and the Earth is still in the midst of this climate period.
The northern great plains of the U.S. experienced an exceptionally mild 2023-2024 winter, about 10 degrees Fahrenheit above normal, due to the onset of a strong El Nino event, now called a Super El Nino by some. As is shown below, this categorization as super is overstated. Hyperbole by the press is a bad habit they just can’t seem to break.
National Geographic defines an El Nino, along with its sister event, La Nina as, “…a climate pattern that describes the unusual warming of surface waters in the eastern equatorial Pacific Ocean. El Nino is the “warm phase” of a larger phenomenon called the El Nino-Southern Oscillation (ENSO). La Nina, the “cool phase” of ENSO, is a pattern that describes the unusual cooling of the region’s surface waters. El Nino and La Nina (EN) are considered the ocean part of ENSO, while the Southern Oscillation (SO) is its atmospheric changes.”
El Nino events last from 9-12 months on average with a rare occurrence lasting up to 18 months. La Nina events can endure for longer periods than El Ninos with some lasting up to 24 months. Both weather events reoccur every 2-7 years for reasons unknown but may be, and this is stretch on my part, related to polar and core wobbles. Earth’s axis experiences two discrete periodic oscillations; the 14 month Chandler Wobble and a 12 month wobble. These two wobbles cause the poles to trace a spiral path over about 6.5 years. Earth’s inner core mysteriously wobbles with a periodicity of approximately 8.5 years. The combination of these wobbles may help explain the peridicity of ENSO weather events.
The National Oceanic and Atmospheric Administration states: “El Nino usually causes increased rainfall and sometimes destructive flooding. La Nina, however, usually causes drier weather in the South, but the Northwest tends to be colder and wetter than average. Even though El Nino occurs in the Pacific Ocean, it often reduces the number of hurricanes that form in the Atlantic Ocean. Conversely, La Nina events tend to be related to an increase in the number of Atlantic hurricanes.”
Hurricanes in the Atlantic Basin occur less often, supposedly, during El Nino than La Nina. This is because there is less vertical wind shear in the troposphere during a La Nina than an El Nino. Wind shear tears hurricanes apart while the lack of wind shear allows hurricanes to form and intensify. Wind shear in the troposphere develops due to pressure gradients which in turn are caused by temperature contrasts between the ocean surface and high-altitude tropospheric air. During El Nino warm ocean surface waters create a greater contrast with the high-altitude cool troposphere air than the cooler La Nina ocean surface waters do. Wind shear lessens when the temperature contrast decreases between the ocean surface and higher altitudes. When ocean temperatures are higher, wind shear is greater resulting in fewer hurricanes. With lower ocean temperatures, wind shear is less resulting in more hurricanes.
This is the theory, whereas actual hurricanes making landfall appear to increase in numbers after weak to moderate El Ninos rather than strong ones. There doesn’t appear to be any correlation between strong El Ninos and increases in hurricanes making landfall during the subsequent La Nina events.
This year’s El Nino was driven by a larger than normal spike in Pacific Ocean temperatures that were about 0.5-degree Fahrenheit above 2022 temperatures. This is considered an exceptionally large increase. This has led to warmer, dryer winters in the upper mid-western states of the U.S. along with greater precipitation in the western U.S.
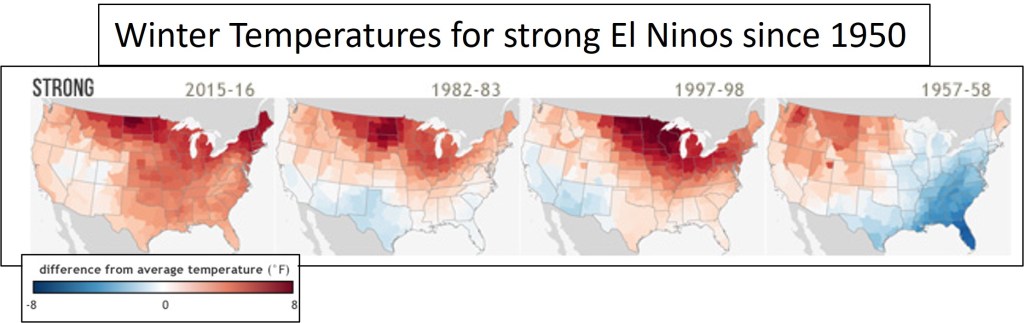
The graph below, from NOAA Climate.gov, shows the change in average winter temperatures during strong El Ninos since 1950. In northeastern North Dakota during the 2023-2024 winter, from the months December to February, temperatures are about 10 degrees warmer on average than the previous year’s winter temperatures. This increase is similar to what was experienced in the 1997-1998 El Nino.
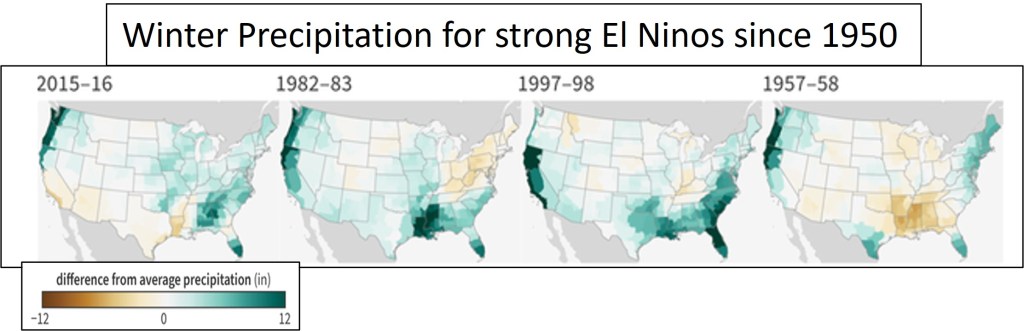
The graph below, again from NOAA Climate.gov, shows winter precipitation during strong El Ninos since 1950. In Long Beach, California the 1997-1998 winter brought 17.77 inches of rain whereas the winter of 2023-2024 has already brought 13.88 inches of rain with 19 days left in the month of February to add to that total. This year’s winter precipitation in Long Beach should be similar to what occurred in the 1997-1998 winter season.
The winter that is occurring in northeastern North Dakota is like what happened temperature-wise 26 years ago during the 1997-1998 winter. Similarly, in Long Beach California the El Nino induced precipitation is likely to be about the same as the totals for this same El Nino event.
In conclusion the strong El Nino of 2022-2023 is a carbon copy of the strong El Nino that occurred 26 years ago during the winter of 1997-1998. The end of 1997-1998 El Nino was followed by seven hurricanes making landfall during the 1999 season suggesting the 2024 season should see about the same number of hurricanes making landfall.
It’s hurricane season but fortunately it’s winding down just to give way to the equally dreadful artic blasts of winter. During the summer season of excess wind, one’s thoughts, for the curious anyway, inevitably lead to queries, theories, or low proof opinions attempting to understand the causality, if any, between the frequency and strength of hurricanes with climate change or global warming. These are perfectly sensible and logical thoughts along with the subsequent questions, such as: Are hurricanes increasing in frequency due to climate change? Are hurricanes increasing in strength due to climate change?
These are valid questions, but likely a more germane question, or three, may be: If climate change is occurring what would the expected outcome be for the frequency and strength of hurricanes? Increasing? Decreasing? Something else? Are human gas inputs into the planet’s atmosphere causally linked to its energy budget?What methods and processes would one employ to answer these questions?
If you thought, I was going to attempt to answer the questions posed above you would certainly be wrong. I do not have the training or knowledge to provide even a precursory opinion, much less a tested and critiqued theory, but I do know how to analyze data and dagnabit I’m going to do just that.
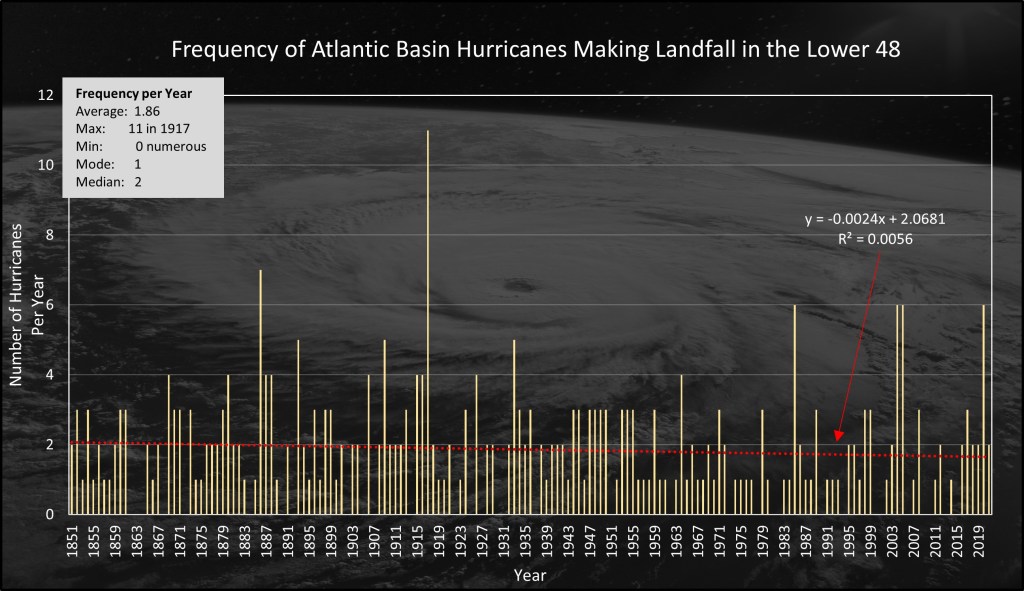
The data used in the analysis below comes from NOAA for the years 1851 through 2021. The data are for hurricane strength only storms, category 1-5, that made landfall over the Atlantic Basin lower 48 states: specifically, the coastal states from Texas to Maine. Excluded from the analysis are all the named Atlantic Basin storms that formed but did not make landfall. Satellites, beginning in the 1960s, are able to observe and track all hurricanes whether they make landfall or not. The satellites have detected considerably more hurricanes developing in the Atlantic Basin than past data, based on storm landfall, suggested. There is a strong link between the recent increase in hurricane strength and frequency due increased observational capabilities rather than anthropogenic origins contributing to climate change.
The graph above plots wind speed in mph versus year of formation for Atlantic Basin hurricanes making landfall along the lower US 48. Years with no hurricanes making landfall are excluded but they account for about 20% of the analyzed interval. The basic analysis of the data shows that for the chosen years, 1851-2021, the average hurricane at landfall is a category 2 storm with an average speed of 100 mph. The trend line shows that the strength of landfall hurricanes has not appreciable changed over the last 170 years: slope of the trend line is 0.0077 or among friends can be taken as 0.
The graph above is the same as the first one shown except, I have attempted to account for the years with no hurricanes making landfall. I accounted for the years of no landfall by setting those data points to 0 mph. I am not comfortable with this approach but ignoring 20% of the data isn’t correct either. The analysis of the data is not significantly different from the previous graph. The average hurricane speed at landfall has decreased to 91 mph from 100 before with the average category being 2. 91 mph is a category 1 hurricane so the average category should be 1 but this is just a rounding up error. Slope of the trend line is again near 0.
The frequency of landfall hurricanes also shows little variation over time. The average number of hurricanes is 1.86 per year with the maximum number of 11 hurricanes occurring in 1917. The gaps in the x-axis are the years with no hurricanes.
The NOAA hurricane data presents a picture of little to no variation in hurricane strength or frequency from 1851-2021. What this says about climate change or global warmer is indeterminant. The question asked above about what changes are expected in hurricane frequency and strength if climate change is occurring needs answering before hurricane variability can be linked to it as a known outcome or consequence.