Trends from February to March 2018:
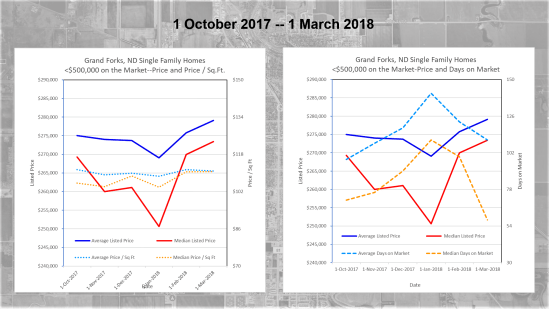
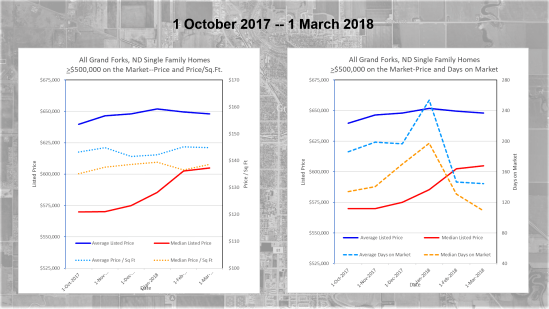
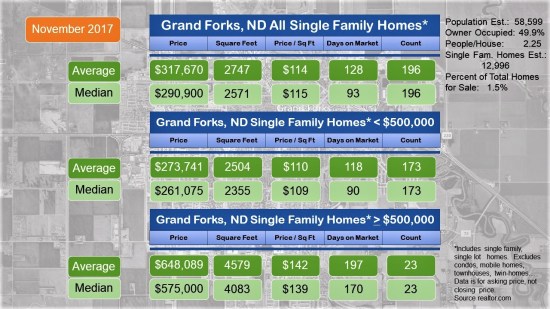
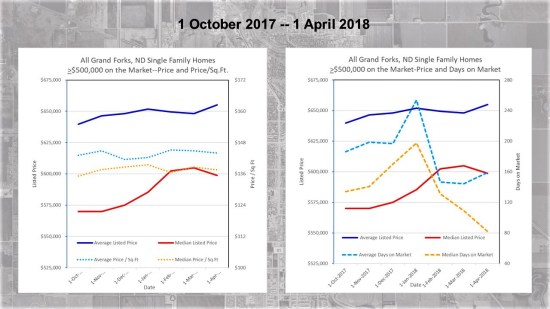
1) Number of homes on the market is flat.
2) Median price per square foot is essentially flat.
3) Median days on the market is increasing. The decrease for homes greater than $500,000 is an anomaly caused by one house coming on the market at the end of the month.
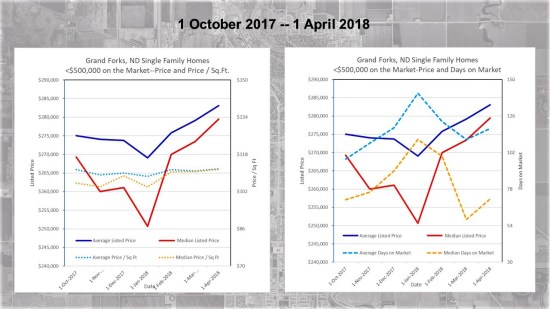
4) Median home prices less than $500,000 continue to increase.
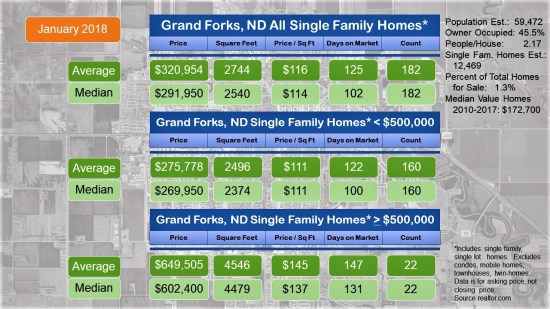
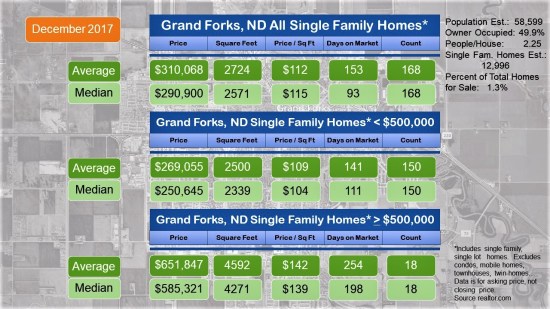
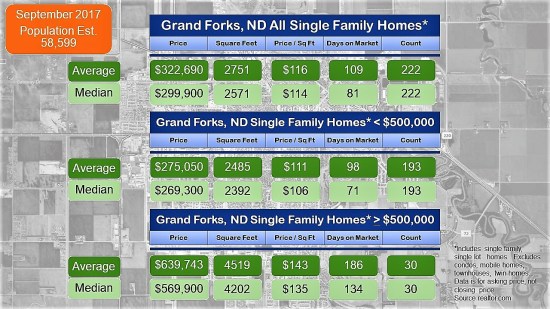
Data is for single family, single lot homes. Does not include apartments, condos, mobile homes, townhouses, twin homes, etc.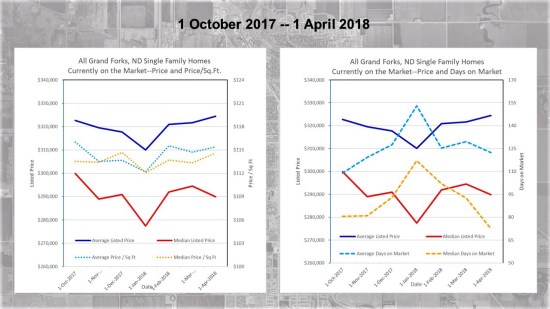
 Trends from the previous month: