
Oh no, they say, he’s got to go
Go go Godzilla, yeah
Oh no, there goes Tokyo
Go go Godzilla, yeah
…
History shows again and again
How nature points up the folly of men
Songwriter: Donald Roeser a.k.a. Buck Dharma 1977 (Blue Oyster Cult)

In the shadows, as far as music is concerned and not nearly as fun as the Godzilla ditty above we have ABBA a less memorable example of fantasy theatrics:
We do the King Kong song, won’t you sing along
Listen to the music and it couldn’t go wrong
We do the King Kong song, gotta sing along
Can’t you hear the beating of the monkey tom-tom?
Listen to the rhythm of the King Kong song
Songwriters: Benny Andersson and Bjorn Ulvaeus 1974 (ABBA)
Recently on Twitter there was some tit-for-tat centered around the Antarctic ozone hole. One side was asking, somewhat sarcastically, why the ozone hole isn’t in the news anymore and the other side replying that it wasn’t in the news anymore because the problem was solved…duh. Journalists and low info opinionistas representing both sides of the argument were putting forth gotcha strawmen that signified fury and snark but proved little and settled nothing. Both sides were uninformed and wrong which is not to say that I’m an expert in ozone and holes, well maybe holes, I dig a lot of them. The ozone hole is in the news, but you must look for it, usually in the science related press, and the consensus is that the solution is found, but there are still questions to answer and the models may need tweaking.
Let’s get the tweaking out the way first before moving on to the problem and possible solution. The scientific method requires an explanation or a hypothesis for an observation in the natural world, for example the ozone hole is caused by ozone destroying CFCs or chlorofluorocarbons such as Freon, sometimes expressed as a R-12 or CCl2F2 (one Carbon, two Chlorine, two Fluorine). An explanation needs to be testable, usually involving a prediction that will support the initial hypothesis such as, if ozone destroying chlorofluorocarbons are eliminated from the atmosphere the ozone hole will ‘close’. The ozone hole is closing but probably not as smoothly as the models first predicted leading to my use of the technical term: tweaking. Just so we don’t get ahead of ourselves let me be clear that most scientific hypothesis and the models generated to support them need tweaking. Most hypotheses are falsifiable as opposed to scientific theories which are not. If a theory is falsifiable, it is no longer a theory. A hypothesis on the other hand may just need a minor adjustment, or major, for the explanation to subsume the new data and or observations and still be valid.
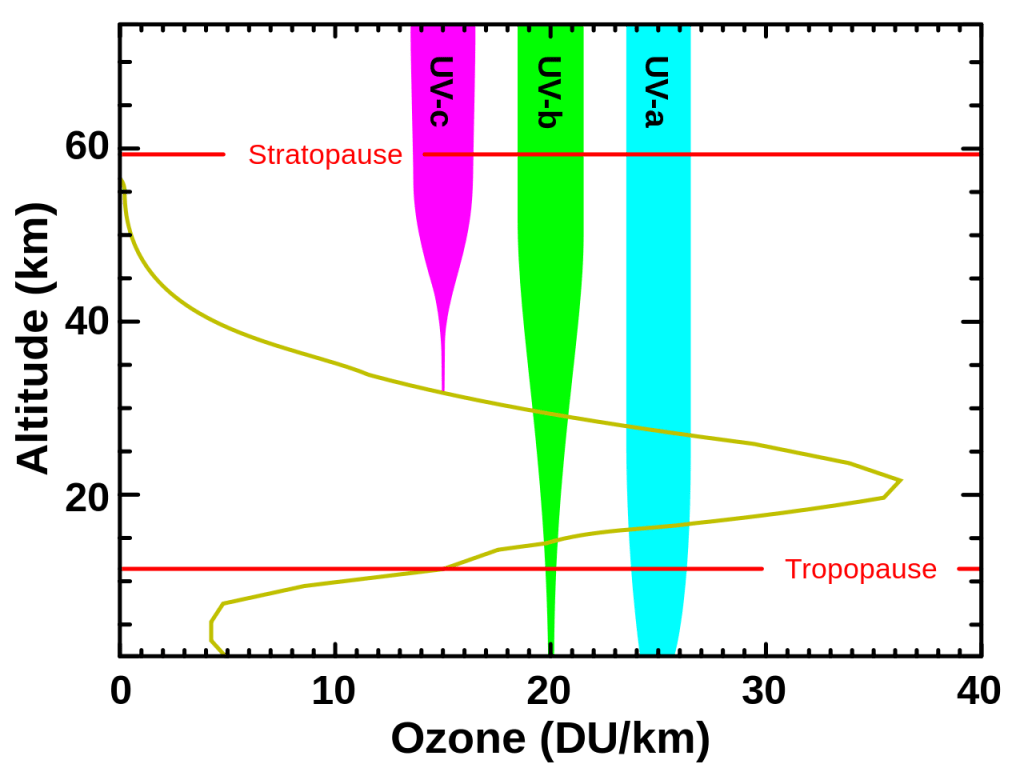
The importance of ozone, O3, and dioxygen, O2, in the atmosphere is that it filters out some to most of the harmful effects of ultraviolet, UV, radiation that comes to the Earth from our Sun. UV radiation comes in three main flavors: UVA, UVB, and UVC progressing from the lower frequency, longer wavelength UVA to the higher frequency, shorter wavelength UVC. UVC is entirely removed by O2 in the upper half of the stratosphere, an atmospheric layer 7-50 kilometers above the surface of the Earth. UVB radiation is mostly removed by ozone in the lower half of the stratosphere, but some of the radiation does make it to the surface of the Earth. UVA radiation travels to the surface of the Earth practically unimpeded.
The graph to the left shows the relative amounts or intensity of the three flavors of UV radiation that pass through the Earth’s atmosphere. The vertical axis on the graph is height above sea level while the horizontal axis measures the amount of ozone in Dobson units per kilometer (DU/km) in the atmosphere. The yellowish curve trending sideways on the graph shows the relative density of ozone in the atmosphere. The outline of the yellowish curve is essentially the ozone layer, with its densest O3 concentration between 20-25 kilometers above the surface of the Earth. UVC in purple is filtered out by O2 and is essentially removed before it even reaches the top of the ozone layer. UVB in green is dramatically reduced as it passes through a healthy ozone layer. The greater the density of the ozone layer the greater the reduction in UVB radiation. UVA rays experience very little reduction in intensity or amount as they traverse the atmosphere.
The harmful effects of UV radiation are significant and different for the different frequencies. Since UVC does not reach the surface of the Earth it is not a big long-term concern but may cause skin burns and eye injuries from artificial sources such as tanning beds. These injuries usually resolve themselves in a week. UVB radiation has been implicated in skin cancers, sunburns, skin blistering, premature aging, and immune suppression. It is also held responsible for darkening and thickening of the skin. UVA is responsible for tanning, sunburns, premature aging, wrinkles, and some skin cancers. There are also benefits from UV radiation. UVC radiation has been used to reduce the spread of bacteria in water, air, and solid surfaces. Hospitals during the height of our collective Covid madness had these UVC light sources dispersed throughout their facilities. UVB, in short time intervals, helps the body in the production of vitamin D useful for maintaining bone and muscle health. UV therapy or phototherapy may also assist in treating rickets, psoriasis, and eczema. Too much exposure to UV radiation can be detrimental to your health but one should get 15-20 minutes of sunlight per day.
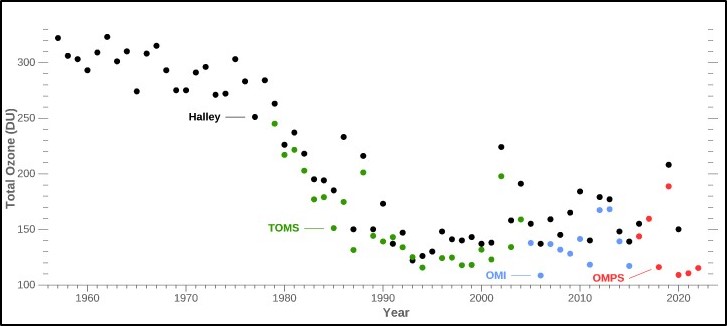
In the Antarctic summer of 1956, the British Royal Society founded the Halley Bay Base Research Station, on the Brunt Ice Shelf. It was built in partial preparation for the International Geophysical Year of 1957-58. (Only governments can dictate singular nouns to be plurals.) As part of their mandate the Royal Society began to collect ozone measurements indirectly using a Dobson Spectrophotometer. The black dots in the graph to the left are data collected by the Halley Base at the surface while the colored dots are derived from NASA satellite measurements. From the beginning of the measurements at Halley through the end of 70s the results showed a slight but noticeable decrease in ozone in the skies over Antarctica. From 1980 onward the loss of ozone as measured from Halley and NASA satellites became pronounced and until the mid-1980s, inexplicable.
In 1985 Joe Farmin and his team with the British Antarctica Survey published a paper in Nature describing this catastrophic 40% loss of ozone over the south pole in less than 10 years. His team also identified the atmospheric release of CFCs as the probable causative agent in creating the ozone hole over the Antarctic.
Additional chemical, meteorological, and atmospheric research in 1986 through 1988 produced the needed theoretical and empirical evidence to implicate chlorine as the ruinous perpetrator responsible for the global loss of ozone. This research and the recognition of the detrimental health effects due to the loss of ozone led directly to the Montreal Protocol, an international treaty designed to protect and heal the atmospheric ozone layer.
The treaty was signed in 1987 with an effective implementation date of 1 January 1989. The treaty has been universally ratified. The main purpose of the treaty was to phase out various forms of man-made chlorine and bromine chemicals, both halogens, that make their way into the stratosphere. In 2012 it was estimated that 98% of the ozone depleting chemicals have been phased out and their concentration in the stratosphere was beginning to decline. In 2018 China, a signatory to the treaty, was implicated in the continued production and release of CFCs.
Current ozone models predict that ozone levels in the northern and southern hemisphere mid-latitudes along with the Artic will revert to 1980 levels by the 2040s. Antarctic ozone should revert to 1980 levels sometime in the mid-2060s. These estimates have fluctuated by 20-30 years, plus or minus since the first predictions came out in the 1990s.
Ozone is three atoms of oxygen combined into one molecule and is found in higher concentrations in the lower to middle parts of the stratosphere which is 7-50 kilometers above sea-level, where it absorbs solar derived ultraviolet radiation. This higher concentration of ozone in the stratosphere is usually referred to as the Ozone Layer. An ozone molecule will split into a single oxygen atom and a two-oxygen molecule, O2, after absorbing a packet of bond breaking UVB radiation. The oxygen atom and the O2 molecule will eventually recombine into an ozone molecule under the right conditions. This oxygen cycle of combinations and breakups are temperature dependent with colder temperatures retarding recombination of oxygen atoms and O2 molecules into ozone molecules. The colder it is in the stratosphere the longer it takes to produce new ozone and it can get very cold in the stratosphere, especially in the Antarctic skies.
A visual confirmation of very low temperatures in the ozone layer of the stratosphere is the presence of Polar Stratospheric Clouds or PSCs. These clouds were likely seen by 19th and early 20th century explorers, including R.F. Scott in 1912. These clouds probably have existed in the Antarctic winter skies since the continent parked itself over the south pole towards the middle of the Cretaceous 100 million years ago. These are stratiform clouds made up of droplets of frozen water and nitric acid forming at temperatures below -78 degrees Celsius. Nitric acid is a catalyst also implicated in the destruction of ozone in the stratosphere.
Nitric acid does not have a strictly natural or human source but is an end product through chemical reactions with nitrogen oxide in the atmosphere. When nitrogen oxide absorbs sunlight in the atmosphere it reacts with O2 to form nitrogen dioxide. Nitrogen dioxide then reacts with water to produce nitric acid and more nitrogen oxide. Natural sources produce about 90% of the world’s nitrogen oxide including lightning strikes, volcanoes, oceans, and biological decay in soil and water. Human sources such as cars and trucks, coal-fired power plants, large industrial operations, ships, and airplanes account for the rest. Eliminating the planet of anthropogenically produced nitrogen oxide will not have any noticeable effect on the continued destruction of ozone in stratosphere by nitric acid although the possibility of supersonic jets passing through the stratosphere could theoretically introduce nitric acid directly into this atmospheric layer.
PSCs also electrostatically attract, concentrate, and store CFCs. Chlorine, the first C in CFC, is another catalyst that acts in concert with nitric acid to increase the destruction of ozone in the stratosphere. Chlorine atoms are released from the CFC molecules when the molecular bonds are broken through the absorption of atmospheric photons traveling from the Sun. The individual chlorine atoms then react with ozone to produce ClO plus O2. The ClO further reacts with a single oxygen atom to produce Cl and O2. With the chlorine atom freed from the oxygen atom it can start the whole ozone destructive cycle all over again. One chlorine atom will eventually destroy thousands of ozone molecules.
Ozone depletion is a global occurrence but due to Antarctica’s unique geography the depletion is most intense and widespread there. Due to the huge atmospheric temperature gradient between Antarctica and the tropics and the continent being surrounded by water causes winds over the southern land mass to move in a clockwise direction creating a stratospheric polar vortex. This vortex effectively contains and sustains a single static air mass over the continent that does not mix with the rest of the earth’s atmosphere, leading to the above-mentioned concentration and storage of CFCs.
During the Antarctic spring, atmospheric temperatures rise, and the frozen PSCs melt in the stratosphere to release all the CFCs and nitric acid compounds that were previously absorbed and stored in the cloud. The CFCs and nitric acid are now free to begin their destruction of ozone molecules. Through this process the infamous ozone hole is formed during the Antarctic spring which partially closes again during the Antarctic winter.
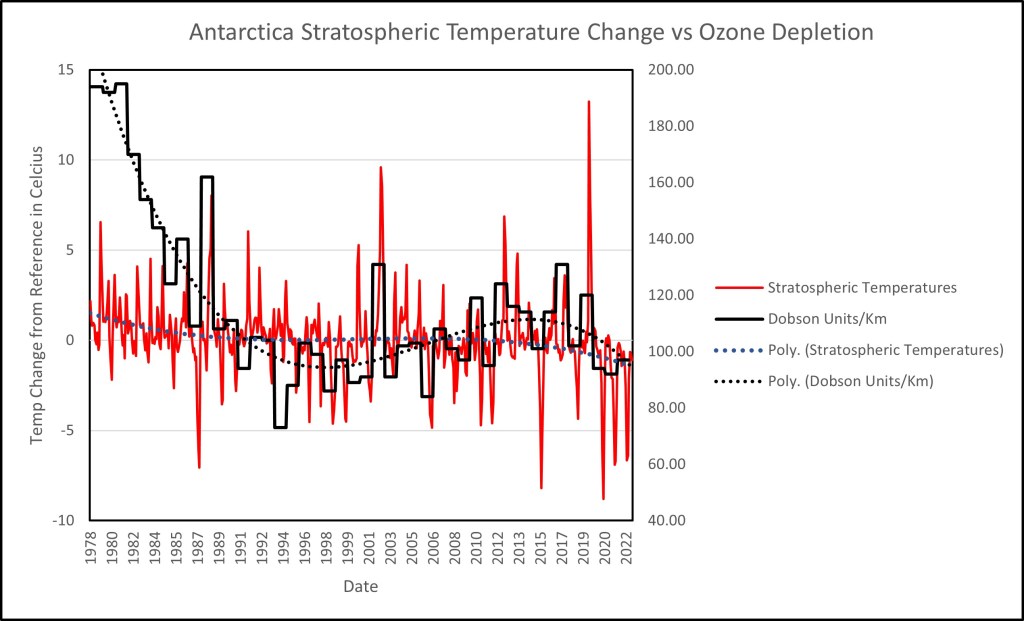
The graph to the right shows the south pole stratospheric temperature and Dobson NASA satellite derived data. The solid red line shows the temperature difference from the 1991-2020 monthly average. The dotted blue line is a polynomial fit to the temperature data that exhibits a slight cooling trend from 1979 through 2022. The temperature spikes, negative and positive occur during the Antarctic spring months of September through November. The temperature spikes usually come in pairs. A large negative value temperature spike in the Antarctic spring is generally followed by a large positive value temperature spike in the spring of the following year. This duality of temperature pairs seems paradoxical or at least inexplicable. The answer is not readily apparent but may lie in the fact that CFCs not only destroy ozone but are also powerful greenhouse gases. More powerful than CO2, methane, and laughing gas but less so than water vapor. In the cool spring years additional CFCs may be concentrated and stored in the stratosphere provoking a feedback loop with solar radiation that raises stratospheric temperatures the following spring. More on this below but this hypothesis is just an unsupported conjecture at this point. A noticeable exception to this observation is the three large negative temperature spikes in 2020, 2021, and 2023 which were not followed by corresponding positive spikes. Is this evidence of the removal of CFCs from the stratosphere causing less heat to be trapped there?
The black solid line on the graph above is the lowest yearly minimum Dobson Unit/km values. Lower Dobson values equate to larger ozone losses. The lowest yearly Dobson minimum represents the maximum ozone loss for that year. The yearly minimum Dobson values usually occur in Antarctica spring months of September through November. Higher or lower Dobson values do not display a significant correlation with the stratospheric temperature spikes except they both occur in the springtime suggesting other variables are at play. The other factors may include water vapor and ice, nitric acid, Chinese abrogation of the Montreal Protocols… The black dotted line is a polynomial fit to Dobson data and suggests that beginning in the early 2020s the ozone hole started increasing in size again. The ozone scientific community says it is closing.
And now, just to give you something else to chew on, putting Godzilla and King Kong together in the same playroom, it is known, as stated above, that CFCs, in addition to depleting ozone in the stratosphere, are potent greenhouse gases. In a 2013 University of Waterloo (Canada) discussion published on phy.org stated that “Chlorofluorocarbons (CFCs) are to blame for global warming since the 1970s and not carbon dioxide, according to new research from the University of Waterloo published in the International Journal of Modern Physics B…” Professor Lu, author of the published paper: Cosmic-Ray-Driven Reaction and Greenhouse Effect of Halogenated Molecules: Culprits for Atmospheric Ozone Depletion and Global Climate Change, comments that “Most conventional theories expect that global temperatures will continue to increase as CO2 levels continue to rise, as they have done since 1850. What’s striking is that since 2002, global temperatures have actually declined – matching a decline in CFCs in the atmosphere. My calculations of CFC greenhouse effect show that there was global warming by about 0.6 °C from 1950 to 2002, but the earth has actually cooled since 2002. The cooling trend is set to continue for the next 50-70 years as the amount of CFCs in the atmosphere continues to decline.”
The decline in surface temperatures was actually true at the time of Lu’s comment above, but global temperatures began to increase post 2013 and then began to decline again in the early 2020s. Is climate cyclic?
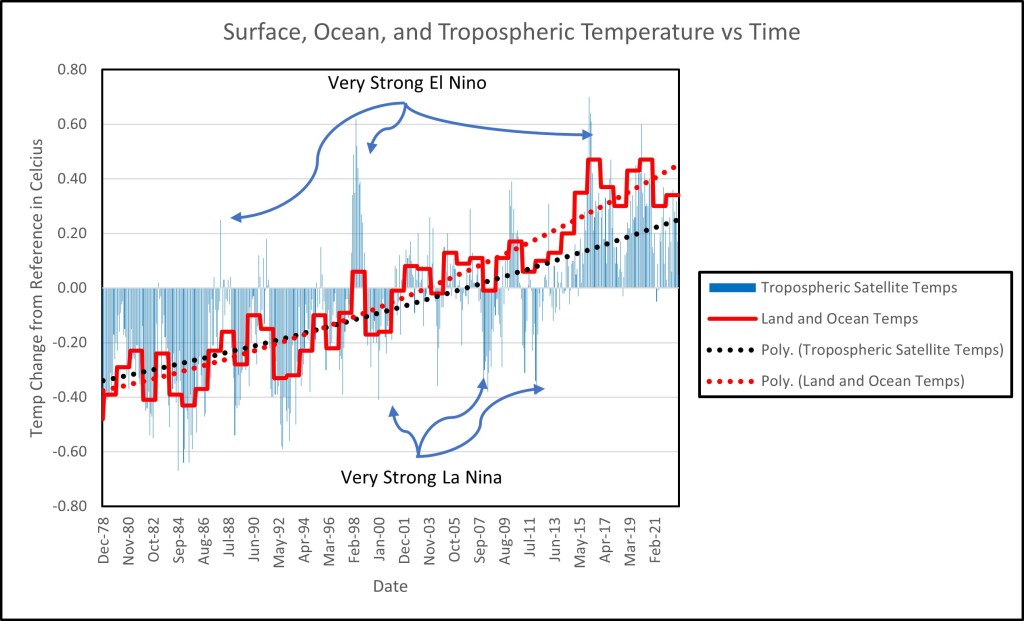
The graph to the left is derived from published NASA surface and atmospheric temperature data. The data in blue is globally collected satellite data for tropospheric temperatures: the atmospheric layer from the surface of the Earth to the base of the stratosphere. The y-axis is the monthly change in temperatures from the 1991-2020 average. Some of the large spikes in temperatures are attributed to exceptionally strong El-Nino or La Nina events–in other words, weather rather than climate. El-Nino generally is responsible for warmer than normal temperatures while La Nina generally leads to cooler than normal temperatures. There is a broad concurrence between the satellite and surface temperature collected data with both showing a slight cooling from 2015 to present day, but it is probably too soon to call this a long-term trend. The stall in temperature increase is curious and may be related to the removal of CFCs from the stratosphere.
The black dash line is a polynomial fit of satellite data trend. The satellite trend shows approximately a 0.6-degree Celsius warming since 1979. The solid red line is the globally collected surface and ocean buoy temperature data. The data was shifted to equal the 1979 satellite data points while retaining the actual slope. This was done to facilitate comparison between the data sets. The red dotted line is the polynomial fit to the surface land and ocean data trend. The surface data trend shows approximately a 0.8-degree Celsius warming since 1979. The surface and ocean data match the satellite data increase in temperatures until the beginning of century where the two data trends begin to diverge. This divergence is attributed to a land measurement heat island effect and statistical adjustments applied to the surface and ocean data that is not applied to the satellite data.
The old hypothesis was that eliminating CFCs from the atmosphere would restore the ozone layer to its 1980 only slightly damaged state.
It is now believed that higher temperatures will minimize the formation of PSCs and thus the collection, concentration, and storage of CFCs in these clouds thus reducing the loss of ozone. The elimination of man-made CFCs and other halogens will help reduce the rise in temperatures through loss of these greenhouse gases. Without CFCs the ozone layer may heal. Without CFCs the global mean temperature may not rise. That’s my new hypothesis–Godzilla and King Kong may be twins.